


Part of the Hidradenitis Suppurativa Knowledge Library
Somewhere in the last few years you have been shown a percentage. A clinic page, an advertisement, a testimonial reel: a number with a per cent sign after it and nothing behind it. It never said what was counted, who was counted, who quietly dropped out of the count, or what anyone meant by success on the day it was worked out.
You have probably had the opposite experience too. A doctor asks how you have been, and you cannot answer. Three reasonable weeks, then a groin lesion that put you on antibiotics for a fortnight. Better? Better than what?
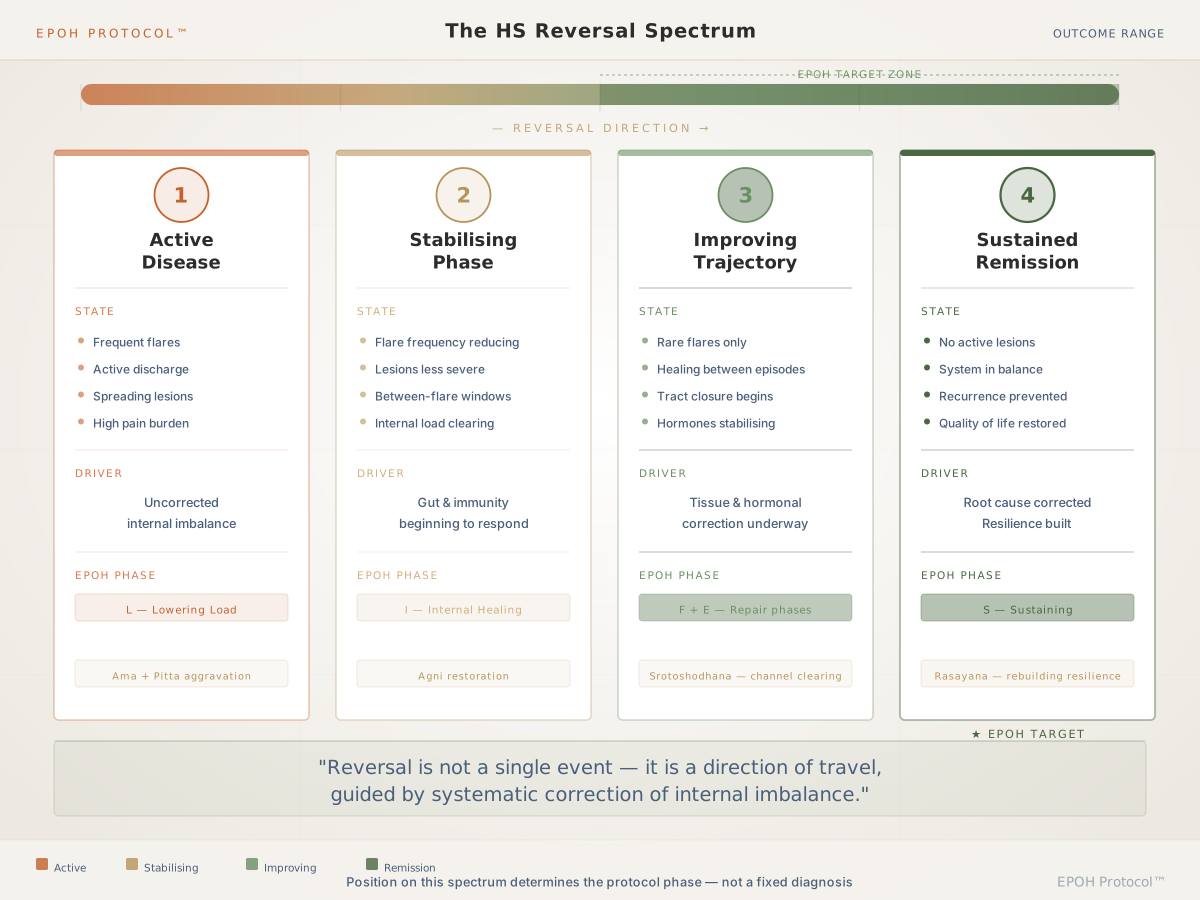
Why clear skin is the wrong first measurement
HS is not a skin condition with systemic complications. It is a systemic condition expressing through the skin: gut dysbiosis, then immune dysregulation, then local tissue pathology. The lesion is the last event in that chain, and visible tissue is the slowest thing in it to change. Judge month two by the mirror and you are measuring a systemic correction by its slowest output.
What moves first is not how the skin looks. It is how often the skin is being asked to produce a lesion.
- Flare frequency reflects the rate at which the underlying process generates new disease — and that process is precisely what Phase 2 (Internal Healing) corrects. It is the measure closest to the mechanism.
- Flare duration reflects repair capacity. Weakened Agni and accumulated inflammatory load (Ama) impair healing long before that shows in a photograph.
An established sinus tract, by contrast, is structure: the record the disease has left, not the process itself. It is worked on later, through Phase 4 (External Care), once the internal environment has shifted — which is why topical work sits fourth in the EPOH phase sequence and not first.
What is recorded at baseline
| Measure | How it is captured | Why it earns its place |
|---|---|---|
| Flare frequency | Episodes per month, from a dated log | The closest proxy for how active the process is |
| Flare duration | Days from onset to resolution | A direct read on repair capacity — what fibrosis destroys |
| Active lesions | Count and site | Separates new lesion formation from old lesions resolving |
| Drainage | Present or absent; volume, character, odour | Often the most disabling symptom, and the least often asked about |
| Pain | Worst-pain rating; days per month on which pain changes what you do | Pain that stops you working is not pain you merely notice |
| Medication load | Drug, dose, frequency: antibiotics, steroids, biologics, hormonal agents | The one figure depending on nobody's memory or mood. Any reduction is agreed with the prescribing physician, never decided alone at home |
| EPOH-DSS stage | EPOH-DSS Stage 1 (Early Nodular) to EPOH-DSS Stage 4 (Advanced Tunnelling); maps to Hurley I–III | Severity now — the line everything else is measured from |
| Driver profile | Gut health, hormonal balance, immune regulation, metabolic function, stress and cortisol | Treatment is built from the driver profile, not the condition name |
| Quality-of-life impact | Work days lost, clothing restriction, sleep disruption, avoidance, intimacy | The reason anybody is here |
When it is recorded
At baseline, before Phase 1 (Lowering the Load) begins, and then at every phase review: the close of Phase 1, through Phase 2, alongside Phase 3 — which supports clearance from within rather than through any procedure — through Phase 4, and across the monitoring period of Phase 5 (Sustaining Remission).
Between reviews the log is yours. Consultation is by video or WhatsApp, which is not a compromise forced by distance; it is the better instrument. Asking someone at month six how often they flared in month one produces recall, not data, and recall in a fluctuating disease drifts towards whatever the person currently believes about their treatment. In both directions.
What a response looks like, in shape
The Recovery Stages describe the order in which change tends to arrive. A pattern, not a promise, and not a schedule anyone is owed.
| Recovery Stage | What is observed | Typical window |
|---|---|---|
| 1 — Internal Shift | Digestion, bowel regularity, sleep, energy. Skin usually unchanged | Weeks 1–4 |
| 2 — Reduced Frequency | The gap between flares lengthens before flares become milder | Months 2–4 |
| 3 — Reduced Severity | Flares are smaller, shorter, less likely to drain | Months 4–8 |
| 4 — Stable Remission | No new lesion formation over a sustained period; tracts healing; medication load reduced with the prescribing physician | Month 8 onward |
Those windows are the earliest point at which each change is reasonably looked for, not a point by which it will necessarily have happened. And they describe response, not severity: a patient can be EPOH-DSS Stage 3 and Recovery Stage 2 at the same time — advanced disease with an early response, which is one of the easiest things to misread as failure.
The Partial Improvement Plateau
Between roughly weeks three and six, many patients notice something — digestion settles, sleep improves, a flare resolves more easily — and then the flares carry on regardless. This is not failure. It is the signature of Phase 1 having done its job: accumulated inflammatory load has fallen far enough for internal markers to move, while the corrective work of Phase 2 — gut lining integrity, microbiome repair, immune recalibration, hormonal patterns — has not yet had time to change what the skin does.
Patients who quit, quit here. That is a clinical fact. It is also a statistical one, and it returns below.
The shape of a claim worth making
An aggregate figure is worth nothing unless you can see what is being counted. So each claim carries its denominator, its timepoint and its definition:
What we measure, against each patient’s own baseline, is this:
- Monthly flare frequency — how often lesions recur, recorded before treatment and again at the Phase 2 review.
- Flare duration — how many days a typical lesion stays active, baseline versus the Recovery Stage 3 review.
- Medication load — whether patients on long-term oral antibiotics at baseline have reduced or discontinued them, in consultation with their prescribing physician.
- Progression by baseline severity — how patients staged EPOH-DSS Stage 1–2 progress compared with those staged Stage 3–4.
- Denominator and attrition — how many patients who began Phase 1 remain in structured follow-up at the Phase 2 review, and when those who discontinued left — so outcomes are read against the whole group, not only those who completed.
We are deliberately not publishing headline percentages until the dataset behind them is large enough, and audited carefully enough, to state without qualification. A figure that has to be walked back later is worse than no figure at all. When the audited numbers are ready they will appear here, each stated with its denominator and its follow-up window beside it — because an outcome percentage without those two things next to it is not really a result, only a claim.
That last line is the one clinics do not publish, and it is the one that decides whether the others mean anything. A figure quoted without a denominator, a timepoint and a stated definition of success is not a finding. It is decoration.
What this data cannot tell you
This is clinic-recorded outcome data. It is not a randomised controlled trial and must not be read as one.
There is no placebo arm and no control group. Everyone recorded is being treated. The effect of the formulations therefore cannot be separated from the natural fluctuation of HS, from the dietary and sleep changes accompanying the programme, or from the effect of being monitored closely by someone who takes the condition seriously. Those effects are real and not trivial — and no clinic's data of this design can separate them. Ours included.
HS fluctuates by itself. Some patients improve during a stretch in which they would have improved anyway, and there is no way to know which ones.
The people who reach us are not a random sample. Almost all have already been through antibiotics, steroids, biologics or surgery, and all are willing to take formulations daily for months. Figures drawn from that group do not automatically transfer to you.
Patients who stop treatment early are the hardest group to follow up — and that biases every clinic's numbers, including ours. People who discontinue rarely complete a final review, and they do not leave at random: the person who leaves is likelier than average to be the person who was not improving, many of them at the Partial Improvement Plateau. If they drop quietly out of the denominator, whatever remains looks better than the truth. This is the single largest weakness in outcome data of this kind, and the only honest response is to publish how many started, how many are still being followed, and how many were lost — which is why those lines appear above.
Most of this is patient-reported. Flare counts, pain and drainage come from the person living with them. That is the correct source, because nobody else knows. It is not a laboratory instrument and will not be presented as one.
Which is why this page gives you the detail instead: each marker, the window in which it typically moves, and the point at which we would tell you it is not working for you.
Measurement has to be allowed to give an unwelcome answer
If the Recovery Stage 1 internal markers have not moved by the close of Phase 1, the phase is not extended in hope — the driver profile is re-examined, because a driver has usually been mis-weighted. And if flare frequency is unchanged against your own baseline once Internal Healing has run its course, that gets said out loud, even when the honest answer is that this will not give you what you came for.
Where this begins for you
You do not need anyone's aggregate numbers. You need your own baseline — flare frequency, flare duration, drainage, pain, medication load, EPOH-DSS stage — written down on a date, so that in four months there is something to compare against other than memory.
That is the first thing a personalised evaluation produces. It is done by video or WhatsApp, formulations are compounded to your driver profile and sent by courier, and none of it asks you to travel.
Medical disclaimer. This article is for general information and is not a substitute for personalised medical advice. Ayurvedic treatment at EliteAyurveda™ is individualised following clinical assessment. Do not start, stop or alter any prescribed medication without consulting your treating physician.

